
Eora Nation Demographics and 1788 Invasion Logistics
The Eora Nation, a shared of approximately 29 clan groups, inhabited the coastal Sydney basin for tens of thousands of years prior to British arrival. Recent archaeological analysis from 2025 places human occupation in the wider region as far back as 60, 000 years, with continuous lineage maintained through the Last Glacial Maximum. By 1788, the Eora population density was high, supported by the rich resources of the harbour and coastal lands. Governor Arthur Phillip estimated 1, 500 inhabitants within a 10-mile radius of Port Jackson, though modern demographic modeling suggests the figure for the broader Sydney basin exceeded 3, 000. Clans such as the Gadigal, Wangal, and Cammeraygal operated within specific territories, maintaining complex social and trade networks. The Gadigal, custodians of the land known as the Sydney CBD, numbered approximately 60 people in 1788.
The invasion force, the " Fleet," departed Portsmouth, England, on May 13, 1787. This naval operation aimed to establish a penal colony, solving Britain's prison overcrowding problem following the loss of the American colonies. The fleet consisted of 11 vessels: two Royal Navy escorts, six convict transports, and three store ships. Logistics were tight, with provisions calculated to sustain the colony for two years. The fleet carried approximately 1, 500 people, including officials, crew, marines, and their families. The human cargo included over 700 convicts, men and women sentenced to transportation for crimes ranging from petty theft to assault. The voyage spanned 252 days and covered 15, 000 miles, with a death rate of roughly 3%.
| Ship Name | Type | Tonnage | Commander | Primary Cargo/Role |
|---|---|---|---|---|
| HMS Sirius | Naval Escort | 540 | Capt. John Hunter | Flagship; Guns, Marines, Officials |
| HMS Supply | Naval Escort | 170 | Lt. Henry L. Ball | Scout; Messages, Personnel |
| Alexander | Transport | 452 | Duncan Sinclair | 192 Male Convicts |
| Scarborough | Transport | 430 | John Marshall | 208 Male Convicts |
| Charlotte | Transport | 345 | Thomas Gilbert | 88 Male, 20 Female Convicts |
| Lady Penrhyn | Transport | 333 | William C. Sever | 101 Female Convicts |
| Prince of Wales | Transport | 350 | John Mason | 1 Male, 49 Female Convicts |
| Friendship | Transport | 276 | Francis Walton | 76 Male, 21 Female Convicts |
| Fishburn | Store Ship | 378 | Robert Brown | Provisions, Tools, Clothing |
| Golden Grove | Store Ship | 331 | William Sharp | Provisions, Chaplain |
| Borrowdale | Store Ship | 272 | Hobson Reed | Provisions, Equipment |
The fleet arrived at Botany Bay between January 18 and 20, 1788. Phillip quickly deemed the site unsuitable due to the absence of fresh water and poor soil. On January 26, the fleet relocated to Port Jackson (Sydney Cove), a site possessing a deep harbour and a fresh water stream. This relocation marked the permanent seizure of Gadigal land. The initial settlement phase was chaotic. Livestock numbers were low, consisting of only 7 horses, 29 sheep, 74 swine, 6 rabbits, and 7 cattle. The soil at Sydney Cove proved poor for European farming methods, leading to immediate food insecurity. The colony depended entirely on the two years of provisions brought from England, much of which spoiled or was eaten by rats.
The immediate demographic impact on the Eora Nation was catastrophic. In April 1789, a smallpox epidemic broke out, devastating the local population. Historical records and modern epidemiological studies indicate a mortality rate between 50% and 80%. The Gadigal clan suffered near-total annihilation, reduced from approximately 60 members to just three survivors by 1791. The source of the outbreak remains a subject of historical analysis. While theories point to Macassan traders in the north, 2025 modeling of disease spread supports the conclusion that the virus originated in the southeast, linking it to the "variolous matter" (smallpox samples) carried by Fleet surgeons for inoculation purposes. This biological disaster cleared the land for British expansion more than muskets, destroying the social fabric and resistance capabilities of the Eora clans.
Even with this devastation, Eora resistance. Warriors like Pemulwuy led guerrilla campaigns against the settlers, targeting supply lines and farms. The British response involved punitive expeditions and the establishment of military outposts to secure the Cumberland Plain. By 1792, the colony had stabilized its food production through the exploitation of land at Parramatta, further displacing the Wangal and Burramattagal peoples. The 1788 invasion and the subsequent 1789 epidemic fundamentally altered the demographics of the Sydney basin, replacing a high-density Indigenous population with a growing penal settlement. This demographic shift set the trajectory for New South Wales, establishing a pattern of dispossession and resource extraction that defines the state's colonial history.
Penal Colony Output and Agrarian Expansion (1789, 1850)

The colony of New South Wales spent its three decades teetering on the edge of starvation. The sandstone soil surrounding Sydney Cove proved chemically hostile to European agriculture, forcing the commissariat to rely on sporadic supply ships from England. By 1790, rations were cut to levels that barely sustained life. Survival demanded expansion into the alluvial floodplains of the Hawkesbury River, a move that placed the penal settlement in direct conflict with the Darug people. The Hawkesbury region, known as Dyarubbin to its custodians, offered deep topsoil capable of high yields, yet it functioned as a hydrological trap. Between 1799 and 1819, the river flooded twenty times. The 1806 deluge saw waters rise 47. 5 feet, destroying 38, 000 pounds sterling worth of property and wiping out the colony's wheat stores. This pattern of boom and bust defined early agrarian efforts, where food security was purchased with the blood of Indigenous defenders and the sweat of forced labor.
Convicts served as the primary economic engine of the colony. The administration did not keep all prisoners in government gangs; instead, they developed the "assignment system," a method of privatizing incarceration. By 1836, approximately 70 percent of the convict population in New South Wales worked for private masters rather than the state. This system reduced government expenditure while providing free settlers with a captive workforce to clear bush, herd sheep, and build homesteads. The Crown retained the power to withdraw labor, a threat that kept the "squattocracy", wealthy land grabbers, politically aligned with the Governor. Convicts who resisted or re-offended faced the "iron gangs" on road projects or secondary punishment at penal hells like Norfolk Island or Moreton Bay. The Great North Road, built between 1826 and 1836, stands as a physical testament to this brutal efficiency, carved out of sandstone by men in leg irons.
The economic trajectory of New South Wales shifted permanently with the crossing of the Blue Mountains in 1813. While colonial mythology credits Blaxland, Lawson, and Wentworth with "discovering" a route, 2024 historical analysis confirms they simply followed ridges long used by Gundungurra people. This crossing breached the geographic containment of the Sydney basin, opening the vast western plains to pastoral expansion. The result was an immediate and violent land grab. The "squatters" drove their flocks onto Aboriginal land without legal title, securing tenure only through occupation and force. This unauthorized expansion birthed the Australian wool industry, which transformed the colony from a jail into a global commodity supplier. In 1822, New South Wales exported 172, 880 pounds of wool. By 1849, that figure exploded to 27. 9 million pounds. The Australian Agricultural Company, incorporated in London in 1824, received a grant of one million acres, exemplifying the of this dispossession.
This agrarian explosion was not a peaceful settlement; it was a military invasion. Governor Lachlan Macquarie, frequently framed in school textbooks as a benevolent builder, ordered the state-sanctioned massacre in the region. In April 1816, following conflict in the Nepean region, Macquarie directed the 46th Regiment to inflict "exemplary and severe punishment" on the "hostile natives." On April 17, soldiers surprised a camp of Dharawal people at Appin. They shot men, women, and children, driving others over the cliffs of the Cataract River gorge. The confirmed death toll was at least 14, though oral histories and subsequent analysis suggest the number was significantly higher. Macquarie ordered the bodies of the slain "hung up on trees in a conspicuous part of the country" to terrorize survivors into submission.
Violence on the frontier escalated in tandem with the sheep population. The Myall Creek massacre of June 10, 1838, marked a rare deviation in the legal history of the colony. A group of eleven convicts and one free settler tethered 28 Wirrayaraay people, mostly women, children, and old men, and hacked them to death with swords before burning the bodies. Unlike hundreds of other massacres, this event resulted in a conviction. Attorney General John Hubert Plunkett prosecuted the case with vigor, securing guilty verdicts for seven of the perpetrators. On December 18, 1838, seven white men were hanged at Sydney Gaol. The execution caused outrage among the settler population, not because of the brutality of the crime, because the colonial government had dared to execute white subjects for killing Aboriginal people. The Myall Creek trial remains a singular event; for the vast majority of the frontier wars, mass murder was an unpunished administrative tool for land clearing.
The penal era officially began to close when the British government ended convict transportation to New South Wales in 1840. This policy shift coincided with a severe economic depression that crippled the colony in the early 1840s. The withdrawal of British capital, combined with a drought and a glut of livestock, caused asset prices to collapse. Sheep that had sold for 35 shillings in the late 1830s plummeted to 6 pence by 1843. With the wool market saturated and livestock worthless, graziers turned to industrial slaughter to salvage value. William Charles Wentworth and other pastoralists pioneered the practice of "boiling down" sheep for tallow. In 1844 alone, settlers boiled down over 200, 000 sheep, converting entire flocks into exportable fat for soap and candles. This grim industry saved the squatter class from bankruptcy, stabilizing the economy just as the social order was about to be upended again.
| Year | Wool Exports (lbs) | Convict Population | Free Population | Key Event |
|---|---|---|---|---|
| 1821 | 175, 000 | ~13, 800 | ~15, 900 | Governor Brisbane arrives |
| 1828 | 834, 343 | 15, 668 | 20, 930 | full Census |
| 1836 | 3, 693, 241 | 27, 831 | 49, 265 | Assignment system peaks |
| 1840 | 8, 610, 755 | 26, 977 | 102, 997 | Transportation ends |
| 1849 | 27, 963, 530 | ~4, 000 (ex-convicts) | 183, 000 | Pre-Gold Rush era |
By 1850, New South Wales had successfully transitioned from a state-run prison to a capitalist agrarian society dominated by a wealthy pastoral elite. The population had swelled to 187, 000, with free settlers and native-born "currency lads and lasses" vastly outnumbering the remaining convicts. The class structure was rigid, defined by land ownership and the stain of "convict stain" ancestry. Yet, the economy remained dangerously reliant on a single commodity: wool. The colony was a vast sheep run, its prosperity built on stolen land and the residue of forced labor. This fragile stability was deceptive. The discovery of gold in 1851 would shatter this agrarian hierarchy, rendering the convict era a distant memory and unleashing a new wave of chaotic, unregulated growth.
Gold Bullion Exports and Regional Settlement Patterns
The history of gold in New South Wales begins not with discovery, with suppression. Between 1823 and 1850, colonial administrators actively concealed evidence of auriferous deposits to maintain penal order. Assistant Surveyor James McBrien recorded particles of gold at the Fish River in 1823, and geologist Paweł Strzelecki found gold near Hartley in 1839. When Reverend W. B. Clarke presented samples to Governor George Gipps in 1844, Gipps commanded him to silence the find, fearing that the colony's 40, 000 convicts would rise in mutiny. This policy of enforced ignorance held until the California Gold Rush of 1849 drained the colony of labor, forcing the government to reverse course and incentivize local exploration.
Edward Hargraves, returning from California with techniques for panning and cradling, identified payable gold at Summerhill Creek near Orange in February 1851. He named the site Ophir. The announcement triggered an immediate demographic convulsion. By May 1851, hundreds of prospectors descended on the central west, and within months, the figure swelled to thousands. The colonial administration imposed a license fee of 30 shillings per month, a revenue method that validated the miner's right to dig yet frequently sparked civil disobedience. In 1852 alone, New South Wales produced approximately 850, 000 ounces (26. 4 tonnes) of gold, a volume of wealth that fundamentally altered the colony's economic trajectory.
The logistical challenge of transporting bullion from the interior to Sydney necessitated the creation of the Gold Escort, a paramilitary convoy system targeted by bushrangers such as Frank Gardiner. To retain wealth within the colony and address a chronic currency absence, the British government authorized the establishment of the Sydney Mint in 1855, the overseas branch of the Royal Mint. Located in the southern wing of the Rum Hospital on Macquarie Street, the facility struck 502, 000 gold sovereigns in its inaugural year. These coins, minted from local bullion, contained silver rather than the copper used in London, giving them a distinct brighter yellow hue and a higher intrinsic value that saw them prized by international traders.
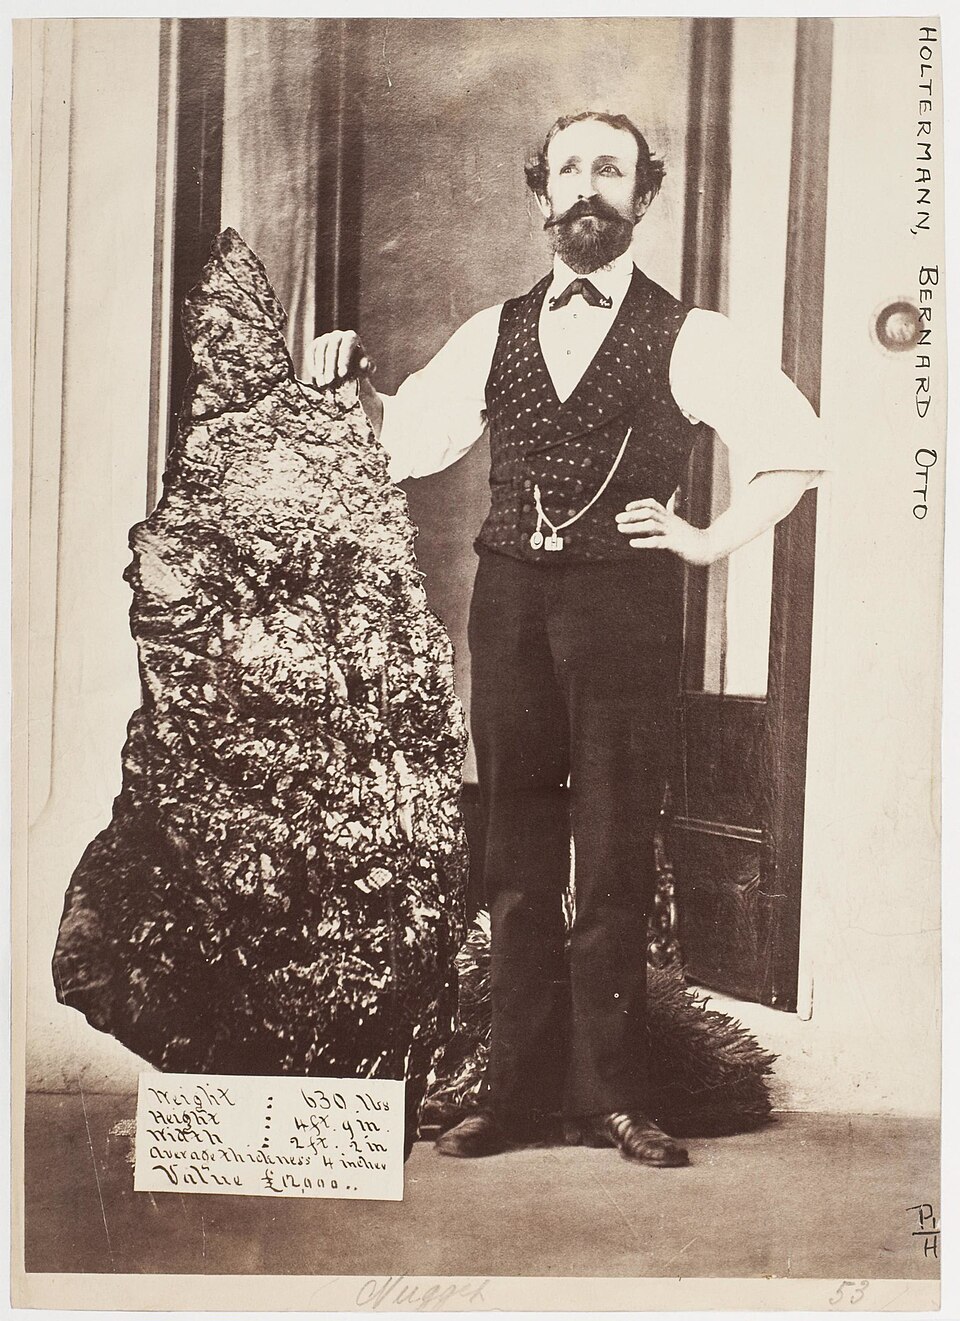
Regional settlement patterns shifted violently from agrarian pastoralism to concentrated urban mining centers. Towns such as Sofala, Hill End, and Gulgong materialized rapidly, their locations dictated by geology rather than water access or soil fertility. Hill End, originally a collection of tents, grew into a substantial municipality with 8, 000 residents, 28 hotels, and a stock exchange by 1872. The extraction of the Holtermann Specimen in October 1872, a 286-kilogram mass of quartz and gold, the largest ever found, marked the zenith of this era. These towns drove the extension of the Great Western Railway, which reached Bathurst in 1876, permanently cementing the link between the resource-rich interior and the coastal capital.
The demographic impact extended beyond British subjects. By 1861, the Chinese population in New South Wales numbered 12, 988, representing a significant minority on the goldfields. Organized under the credit-ticket system and frequently working in cooperative groups, Chinese miners reworked abandoned claims, recovering gold that European miners had missed. This economic success bred resentment, culminating in the Lambing Flat riots of 1860-1861, where European mobs violently expelled Chinese miners from the Burrangong Goldfield. The colonial government responded with the Chinese Immigration Regulation and Restriction Act of 1861, a legislative precursor to the White Australia Policy that imposed heavy poll taxes and entry limits.
As alluvial deposits exhausted surface gold by the 1880s, the industry transitioned to deep-reef mining, requiring heavy capital investment and corporate structures. The solitary digger, replaced by wage-labor miners working for syndicates. Production declined steadily through the early 20th century, with the Sydney Mint closing in 1926 as the gold standard collapsed globally. For decades, gold remained a peripheral element of the NSW economy, overshadowed by coal and wool, until the introduction of modern open-cut and block-caving technologies in the 1990s revived the sector.
In the 21st century, the Cadia Valley Operations near Orange, acquired by Newmont Corporation in November 2023, stands as the dominant force in NSW gold production. Unlike the pick-and-shovel operations of the 1850s, Cadia uses panel caving to extract ore from kilometers underground. In the 2025 fiscal year, Cadia produced approximately 464, 000 ounces of gold, leveraging high global prices that breached $4, 000 AUD per ounce in late 2025. The mine also produces copper and molybdenum, the latter processed in a dedicated plant commissioned in 2022 to supply the steel alloy market, demonstrating the complex metallurgy of modern extraction.
The economic data for the 2024-2026 period indicates a massive resurgence in the value of gold exports. Driven by geopolitical instability and central bank buying, gold became Australia's second-largest export commodity after iron ore in the 2025-2026 financial year, overtaking Liquefied Natural Gas (LNG). Federal forecasts revised in December 2025 projected national gold export earnings to reach $69 billion AUD for the fiscal year 2025-26. New South Wales contributes a substantial portion of this total, with the Central West region once again serving as the primary engine of metallic wealth. The table details the shift in production and value across three distinct eras.
| Metric | 1852 (Alluvial Boom) | 1926 (Mint Closure) | 2025 (Deep Mining Era) |
|---|---|---|---|
| Annual Production | ~850, 000 oz | ~19, 000 oz | ~464, 000 oz (Cadia only) |
| Nominal Price per oz | £3 17s 10d (~$7 AUD) | £4 4s 11d (~$8. 50 AUD) | >$4, 000 AUD |
| Primary Extraction Method | Pan, Cradle, Sluice | Shaft Mining | Panel Caving / Open Cut |
| Key Export Destination | London (via Sydney Mint) | London / USA | China / Switzerland / UK |
| Dominant Demographic | Independent Prospectors | Unionized Wage Laborers | Automated Systems / Engineers |
The settlement patterns established during the 19th-century gold rushes remain visible in 2026. Towns like Orange and Bathurst, born from the logistical needs of the diggings, have evolved into regional service hubs. Conversely, settlements like Hill End serve as preserved artifacts, their populations having collapsed once the ore ran dry. The trajectory of NSW gold mining, from the chaotic, democratized rush of 1851 to the highly automated, capital-intensive operations of 2026, mirrors the broader industrialization of the state. The metal that once paid for the colony's railways functions as a serious hedge in the state's export portfolio, insulating the economy against fluctuations in energy markets.
Federation Logistics and War Economy Manufacturing

| Facility | Location | Primary Output | Peak Production Rate / Total |
|---|---|---|---|
| Lithgow Small Arms Factory | Lithgow | Lee-Enfield Rifles (. 303) | 4, 000 units per week (1943) |
| BHP Steelworks | Newcastle | Steel Ingots & Ship Plate | 1. 6 million tons annually (1944) |
| Chullora Railway Workshops | Sydney | Sentinel Tanks (AC1) | 65 units total (1942, 1943) |
| Villawood Munitions | Western Sydney | Explosives (TNT/Cordite) | Major supplier for Pacific campaign |
Post-war de-industrialization gradually eroded this manufacturing base. The closure of the BHP Newcastle steelworks in 1999 symbolized the end of the heavy industrial era, as the state economy pivoted toward services and finance. Yet, the geopolitical climate of the 2020s forced a re-evaluation of sovereign capability. By 2025, the focus returned to the Hunter Region and the Illawarra, not for mass steel production, for high-tech defense sustainment. In 2026, New South Wales occupies a central position in the AUKUS nuclear-powered submarine program. Port Kembla has been as a primary location for the maintenance and chance basing of nuclear assets, leveraging its deep-water port and existing industrial workforce. The federal government's 2026 defense budget, targeting 2. 4% of GDP, channels billions into the "Guided Weapons and Explosive Ordnance" (GWEO) enterprise. This initiative aims to manufacture advanced missile systems domestically, with facilities in the Mulwala and Orchard Hills precincts expanding to meet stockpile requirements. Thales Australia, operating the historic Lithgow facility, continues to supply the Australian Defence Force with the F90 assault rifle, maintaining the site's continuous operation since 1912. The modern facility bears little resemblance to the labor-intensive workshops of 1943, using automated CNC machining and advanced composites. Simultaneously, Western Sydney has emerged as a hub for autonomous systems, with local firms securing contracts in early 2026 to supply "Ghost Bat" loyal wingman drones and loitering munitions. The logistical challenges of 1901, broken gauges and tariff borders, have been replaced by the complexities of digital supply chains and nuclear stewardship, yet the strategic imperative remains unchanged: the capacity of New South Wales to manufacture the tools of state security is the barometer of Australian sovereignty.
Post-War Migration Data and Suburban Sprawl
The demographic trajectory of New South Wales shifted violently in the aftermath of World War II, driven by the existential anxiety of the "Populate or Perish" mandate. In 1947, the state census recorded a population of roughly 2. 98 million, with 99. 5 percent of residents identifying as British subjects. The Chifley government, represented by Immigration Minister Arthur Calwell, initiated a mass migration program that would this homogeneity. Between 1947 and 1953, the state absorbed tens of thousands of Displaced Persons from war-torn Europe, fundamentally altering the labor force. This was not a; it was a calculated industrial injection. The Snowy Mountains Scheme, commencing in 1949, served as the primary crucible for this shift. Over its 25-year construction, more than 100, 000 workers from 30 distinct nationalities, including Italians, Yugoslavs, and Poles, were funneled into the NSW alpine region, creating the state's truly multicultural industrial enclaves.
This influx necessitated an immediate expansion of the urban footprint, shattering the containment lines drawn by early planners. The 1948 County of Cumberland Plan attempted to encircle Sydney with a "Green Belt" to halt urban sprawl, yet the pressure of population growth decimated this boundary by 1960. Developers and state officials released vast tracts of agricultural land in the Cumberland Plain for subdivision, cementing the quarter-acre block as the dominant housing model. Car ownership rates surged in parallel, allowing low-density suburbs to metastasize westward. By 1971, the urban radius had extended significantly beyond Parramatta, swallowing market gardens in Bankstown and Fairfield to house the burgeoning workforce. The "Great Australian Dream" was built on the consumption of arable land, a pattern that locked Sydney into automobile dependency that in 2026.
The of the White Australia Policy in 1973 under the Whitlam government introduced a new demographic variable: Asian migration. The arrival of Vietnamese refugees following the fall of Saigon in 1975 transformed suburbs like Cabramatta into distinct cultural hubs. Unlike the dispersed European assimilation of the 1950s, this wave concentrated in specific western precincts, creating high-density commercial and residential zones within the low-density sprawl. By the 1990s and 2000s, the source countries shifted again toward China and India, driven by skilled migration visas rather than humanitarian intake. This era coincided with the densification of inner-city transport corridors, yet the outer rim continued to expand. By 2016, the census revealed that for the time, the majority of recent migrants were settling in Greater Western Sydney rather than the inner ring.
The COVID-19 pandemic induced a statistical anomaly in this long-term trend. In the 2020-2021 financial year, Australia recorded a net outflow of migrants (-85, 000) for the time since 1946. This pause was short-lived. The borders reopened, and the rebound was aggressive. In the 2022-2023 period, Net Overseas Migration (NOM) hit a record peak of 556, 000 nationally, with New South Wales absorbing approximately 32 percent of this intake. This surge collided with a chronic construction deficit. By early 2026, the NSW housing market faced a severe imbalance: while population growth returned to pre-pandemic levels, dwelling completions in the 2025-2026 financial year languished around 29, 900 units, well the state's target of 75, 000 per annum needed to meet the National Housing Accord goals.
The consequences of this mismatch are visible in the 2026 demographic data. The "missing middle", medium-density housing in established suburbs, remains largely unrealized due to restrictive zoning and community opposition. Consequently, the population center of has shifted decisively west. As of March 2026, Greater Western Sydney is home to approximately 2. 8 million people, a figure projected to reach 4. 1 million by 2041. The region functions as a separate metropolis, yet infrastructure delivery lags behind residential development. The "30-minute city" concept remains aspirational for residents in the new growth areas of the North West and South West sectors, who frequently face commute times exceeding 90 minutes to the eastern economic corridor.
Current data from the Australian Bureau of Statistics (ABS) indicates that the composition of the NSW population has permanently moved away from its Anglo-Celtic base. In 2026, over 30 percent of NSW residents were born overseas, with India and China serving as the top two countries of birth for non-Australian born residents. The 2024-2025 migration intake saw a moderation to 306, 000 nationally, yet the cumulative effect of the previous three years has placed on the state's carrying capacity. The urban sprawl has reached the natural limits of the Sydney Basin, bounded by the Blue Mountains to the west and the Hawkesbury-Nepean floodplains to the north, forcing a vertical reorientation of the city that contradicts two centuries of horizontal expansion.
| Period | Primary Migrant Demographics | Dominant Urban Form | Key Infrastructure / Policy |
|---|---|---|---|
| 1947, 1960 | UK, Ireland, Northern Europe (Displaced Persons) | Public Housing Estates, fibro cottages | Snowy Mountains Scheme, "Populate or Perish" |
| 1961, 1975 | Italy, Greece, Yugoslavia, Lebanon | Quarter-acre block sprawl (Western Suburbs) | Release of Green Belt land, Warringah Expressway |
| 1976, 1990 | Vietnam, Hong Kong, Philippines | Suburban infill, dual-occupancy | End of White Australia Policy, M4 Motorway |
| 1991, 2010 | China, India, UK, South Africa | McMansions (Outer Ring), CBD Apartments | M2, M7, Olympic Park development |
| 2011, 2026 | India, China, Nepal, Philippines | High-density TODs (Transport Oriented Development) | Sydney Metro, WestConnex, Western Sydney Airport |
The friction between population and livability metrics defines the political reality of 2026. While the federal government calibrates visa intakes to manage economic aggregate demand, the state government grapples with the physical logistics of housing a population that grows faster than its supporting infrastructure. The 2025 release of the "Transport Oriented Development" program identified 31 station precincts for forced upzoning, a direct admission that the sprawl model is fiscally and environmentally insolvent. Yet, construction insolvencies and labor absence in the building sector have stalled these high-density projects. The result is a bifurcated state: an inner city of high-cost vertical living and an outer rim of sprawling, heat- suburbs, both struggling to accommodate the 100, 000+ net new residents arriving in New South Wales annually.
Asbestos Litigation and Industrial Health Records

New South Wales stands as the global epicenter for asbestos litigation, a distinction forged not by geology by a unique legal architecture designed to counter corporate evasion. The state established the Dust Diseases Tribunal (DDT) in 1989, the specialist court in the world dedicated exclusively to hearing claims for dust-related conditions. This judicial innovation emerged from a grim need. Trade unions and victims' advocates demonstrated that standard court backlogs allowed terminally ill plaintiffs to die before their cases reached trial. The DDT introduced expedited evidence rules and urgent bedside hearings, ensuring that testimony from dying workers entered the public record before it was lost forever. By 2026, the Tribunal remains the primary venue for seeking redress against manufacturers who knowingly exposed generations of workers to lethal fibers.
The most notorious chapter in this legal history involves James Hardie Industries. In 2001, the company executed a corporate restructure that moved its domicile to the Netherlands, separating its profitable assets from its asbestos liabilities. The Medical Research and Compensation Foundation (MRCF), established to handle these claims, was left with a funding shortfall eventually estimated at over $1. 5 billion. The 2004 Special Commission of Inquiry, led by David Jackson QC, exposed this maneuver as a calculated attempt to shed liability. The inquiry revealed that the company provided misleading financial assurances to the NSW Supreme Court. Public outrage, spearheaded by campaigner Bernie Banton, forced the company to sign the Asbestos Injuries Compensation Fund (AICF) agreement in 2006. Yet the fund's solvency has repeatedly teetered. In 2015, the NSW Government had to extend a $320 million loan facility to prevent payment rationing. As of 2026, the AICF continues to rely on this government-backed lifeline to pay victims in full.
While James Hardie dominates the headlines, the tragedy at Baryulgil reveals a racial in industrial health records. From 1944 to 1979, a subsidiary of CSR Limited operated an asbestos mine in this remote Indigenous community. Unlike the organized workforce at James Hardie plants, the Bundjalung people working at Baryulgil were afforded minimal protection. Tailings were used to pave roads and fill playgrounds. Medical records from this period are sparse or nonexistent, a gap that later compensation claims. A 1984 parliamentary inquiry found that the company failed to warn workers of the dangers. Even with this finding, compensation payouts for Baryulgil residents have historically been a fraction of those awarded to white workers in metropolitan centers. The isolation of the community allowed the operator to maintain a paternalistic control over health data, erasing the early evidence of occupational disease.
The physical scars of this industry remain visible at the Woodsreef Mine near Barraba. Closed in 1983, the site still contains approximately 24 million tonnes of asbestos tailings. For decades, these piles stood open to the elements, eroding into local waterways and generating airborne fibers. Remediation efforts have been lethargic. While the NSW Government completed minor containment works such as fencing and capping in the late 2010s, the massive tailings dump remains a derelict hazard in 2026. It stands as a monument to the era when extraction profit outweighed public safety, leaving the state to manage the toxic inheritance indefinitely.
The threat of asbestos is not confined to 20th-century mining history. In January 2024, a new emergency erupted when bonded asbestos was discovered in recycled mulch at the Rozelle Parklands in Sydney. The contamination triggered the largest investigation in the history of the NSW Environment Protection Authority (EPA). Inspectors traced the supply chain to Greenlife Resource Recovery and identified over 75 contaminated sites, including schools, hospitals, and public parks. This event, known as the "Mulch emergency," shattered the assumption that asbestos was solely a legacy problem. It exposed widespread failures in the recycling industry, where demolition waste containing "bonded" asbestos, cement sheeting, was ground into garden mulch and distributed across the city. By December 2024, the EPA had commenced prosecutions against multiple corporate entities, signaling a new era of strict liability for supply chain contamination.
Industrial health records in NSW are tracking a new epidemic: silicosis. frequently termed the "new asbestos," this incurable lung disease surged among stonemasons cutting engineered stone for kitchen benchtops. The dust from this artificial material contains up to 95% crystalline silica. In response to skyrocketing case numbers among young workers, NSW joined a national ban on the manufacture, supply, and installation of engineered stone, July 1, 2024. This regulatory action was faster than the century-long delay for asbestos bans, yet it came too late for hundreds of tradespeople. The Dust Diseases Tribunal has seen a shift in its docket, with silicosis claims rising as the third wave of asbestos claims, from home renovators, begins to plateau.
| Period | Event / Entity | Impact on Public Health & Law |
|---|---|---|
| 1944, 1979 | Baryulgil Mine Operation | CSR subsidiary mines asbestos in Indigenous community. Tailings used in local infrastructure. Minimal health records kept. |
| 1983 | Woodsreef Mine Closure | Mine closes, leaving 24 million tonnes of tailings. Site remains a remediation challenge through 2026. |
| 1989 | Dust Diseases Tribunal (DDT) | World's specialist court for dust disease established to expedite hearings for dying plaintiffs. |
| 2004 | Jackson Inquiry | Exposed James Hardie's $1. 5bn funding shortfall and corporate restructuring to avoid liability. |
| 2006 | AICF Established | Asbestos Injuries Compensation Fund created to manage payouts, funded by James Hardie profits. |
| 2024 | Sydney Mulch emergency | Bonded asbestos found in recycled mulch at Rozelle Parklands and 75+ sites. Major EPA investigation. |
| 2024 | Engineered Stone Ban | NSW enforces ban on engineered stone to halt the surge in silicosis cases among stonemasons. |
The trajectory of industrial disease in NSW shows a grim evolution. What began as a hazard for miners in the mid-20th century became a disaster for manufacturers and builders, and a risk for the general public in parks and schools. The Dust Diseases Tribunal serves as the central repository for this history, its case files documenting the shift from raw fiber extraction to the insidious recycling of contaminated materials. As of 2026, the state's management of these risks relies on a combination of aggressive litigation, government-backed compensation guarantees, and strict supply chain monitoring, a tripartite defense built on the hard lessons of the past century.
Police Corruption and Royal Commission Findings
| Era | Key method of Misconduct | Notable Figures/Units | Outcome/Status |
|---|---|---|---|
| 1790s, 1810s | Rum Monopoly & Military Coup | NSW Marine Corps ("Rum Corps") | Deposition of Gov. Bligh; established entrenched power. |
| 1960s, 1970s | "The Joke" (Gambling/Vice Protection) | Premier Robert Askin, Comm. Norman Hanson | State-sanctioned organized crime; massive illicit wealth transfer. |
| 1980s | Armed Hold-Up Squad Corruption | Roger Rogerson, Neddy Smith | Extrajudicial killings (Lanfranchi); drug trafficking by detectives. |
| 1998, 2002 | Internal Bugging Scandal | Operation Prospect (Mascot/Florida) | Illegal surveillance of 100+ officers; compromised internal investigations. |
| 2020, 2026 | Politicized Policing & Civil Rights Abuse | Fixated Persons Unit, Strip Search | Targeting of journalists/critics; 86% failure rate in strip searches. |
The weaponization of counter-terrorism legislation against domestic dissent represents the latest evolution of this malaise. The Fixated Persons Unit (FPU), established in 2017 to monitor "lone wolf" terrorists, has faced intense scrutiny for its deployment against political critics and journalists. The 2021 arrest of a producer for the *Friendlyjordies* YouTube channel, and subsequent controversies involving the unit in 2024 and 2025, demonstrate "mission creep" where the definition of a "fixated person" expands to include those who embarrass the state apparatus. Internal police politics remain as vicious as the streets they patrol. Operation Prospect (2012, 2016) investigated the bugging of over 100 officers during internal probes between 1999 and 2002. The operation, which cost nearly $10 million, found that Deputy Commissioners Catherine Burn and Nick Kaldas were involved in or targeted by unlawful conduct, decapitating the force's leadership chance for a generation. The LECC's 2025 report highlights that the force continues to resist external oversight, engaging in disputes over information access that investigations into serious misconduct. The trajectory from the Rum Corps to the Fixated Persons Unit shows a consistent theme: the NSW Police Force frequently operates as a power center unto itself, frequently resistant to the democratic controls it is sworn to uphold. While the brazen criminality of the Rogerson era has receded, it has been replaced by a bureaucratic impunity that shields officers from the consequences of unlawful searches, politicized arrests, and the widespread harassment of communities.
Property Developer Influence and Zoning Irregularities

The history of New South Wales is inextricably bound to the commodification of land, a established not by free enterprise, by the monopolistic seizures of the NSW Corps in the late 18th century. From the moment officers like John Macarthur began granting themselves prime tracts of Eora country in the 1790s, land development became the primary engine of wealth accumulation and political corruption in the state. This lineage of influence stretches unbroken from the Rum Rebellion to the rezoning scandals of the 2020s, creating a political culture where planning laws are frequently treated as obstacles to be circumvented rather than rules to be followed.
By 1792, the departure of Governor Arthur Phillip left a power vacuum filled by the NSW Corps, who rapidly appropriated land for themselves and their associates. This early land grab set a precedent: those with proximity to executive power could rewrite the map of Sydney for personal gain. The "Rum Corps" did not trade in spirits; they traded in the exclusive rights to develop the colony's resources. This structural flaw, the intersection of public office and private property speculation, remained dormant potent until the post-World War II construction boom transformed Sydney from a low-rise colonial outpost into a vertical metropolis.
The premiership of Robert Askin (1965, 1975) represents the modern crystallization of this corruption. Askin's tenure was characterized by an aggressive pro-development agenda that frequently bypassed municipal objections. Investigative inquiries later revealed that Askin and Police Commissioner Fred Hanson received annual bribes estimated at $100, 000 (unadjusted) from organized crime figures and developers to facilitate rezoning and ignore vice operations. The era was defined by the violent suppression of community opposition, culminating in the 1975 disappearance and presumed murder of publisher Juanita Nielsen. Nielsen had campaigned against the redevelopment of Victoria Street in Kings Cross, a project spearheaded by developer Frank Theeman. Her death remains a grim marker of the involved when residents challenge the nexus of state power and property capital.
The method of influence shifted in the late 20th century from direct bribery to the manipulation of planning instruments. The introduction of "State Significant Development" pathways allowed the state government to seize control of major projects from local councils, ostensibly to streamline economic growth. This centralization of power created fertile ground for the scandals exposed by the Independent Commission Against Corruption (ICAC) in the 2010s. Operations Jasper and Acacia revealed that Labor powerbroker Eddie Obeid and Minister Ian Macdonald conspired to grant mining exploration licenses over the Obeid family's farm in the Bylong Valley. The scheme, which relied on insider knowledge of state planning decisions, stood to net the family a windfall exceeding $30 million. This was not an incident a widespread failure where the of government was weaponized to land values for insiders.
The subsequent Liberal administration, while establishing the Greater Sydney Commission to depoliticize planning, presided over a deregulation era that birthed the building quality emergency of 2018, 2025. The rush to supply housing led to the proliferation of private certification, allowing developers to grade their own homework. The consequences were catastrophic: the evacuation of the Opal Tower in 2018 and Mascot Towers in 2019 due to structural cracking exposed a rot in the construction sector. Thousands of residents were left with worthless assets, trapped in buildings deemed unsafe for habitation.
Central to this emergency was the figure of Jean Nassif, founder of Toplace. Nassif became the avatar of the "cowboy" developer era, famous for gifting a yellow Lamborghini to his wife while his buildings were with defects. By June 2023, NSW Police had issued an arrest warrant for Nassif over allegations of a $150 million fraud involving falsified pre-sale contracts to secure financing from Westpac. Nassif fled to Lebanon, leaving behind a legacy of defective apartment blocks and a company in administration. His ability to operate for decades, even with repeated warnings from fair trading bodies, highlighted the regulatory paralysis that plagued the state.
In response to the emergency, the appointment of David Chandler as NSW Building Commissioner in 2019 marked a temporary pivot toward enforcement. Chandler's "Project Intervene" and his use of occupation certificate audits forced developers to rectify defects before settlements occurred. Yet, even Chandler faced immense pressure; his temporary resignation in 2022, triggered by interactions with the office of then-Minister Eleni Petinos regarding Coronation Property Group, exposed the continued friction between regulatory oversight and developer lobbying. Chandler eventually departed in August 2024, leaving the long-term enforcement of these standards in question as the state pivoted back to aggressive supply.
The election of the Minns Labor government in 2023 ushered in the current era of "Transport Oriented Development" (TOD), a policy framework fully operational by 2026. Under the banner of solving the housing emergency, the government enacted the TOD State Environmental Planning Policy (SEPP), which rezoned land within 400 meters of 31 metro and rail stations. This policy stripped local councils of their planning authority in these precincts, mandating high-density approval pathways that overrode local heritage and character controls.
While framed as a need for housing supply, the TOD program represents one of the largest transfers of value to private landowners in NSW history. Properties within the "Tier 1" and "Tier 2" zones saw immediate valuation spikes, frequently exceeding 40% overnight, purely due to the stroke of a legislative pen. Critics that without a strong "betterment tax" to capture this uplift for public infrastructure, the state has gifted billions in land value to incumbent owners and speculators. The program also reintroduced the risk of "spot rezoning" corruption, as developers lobbied intensely to have specific precincts included or excluded from the density mandates based on their land banks.
The following table summarizes the evolution of developer influence method in NSW from the colonial era to the present day:
| Era | Primary method | Key Scandal/Event | Outcome |
|---|---|---|---|
| 1792, 1810 | Direct Land Grants | Rum Rebellion | Monopolization of prime agricultural land by military officers. |
| 1965, 1975 | Cash Bribery & Intimidation | Juanita Nielsen Murder | Violent suppression of anti-development activism; eventual Green Bans. |
| 2000, 2013 | Insider Trading / Spot Rezoning | Operation Acacia (Obeid/Macdonald) | Criminal convictions for Ministers using office to land value. |
| 2014, 2023 | Private Certification / Deregulation | Opal & Mascot Towers / Jean Nassif | widespread building defects; flight of developers to avoid prosecution. |
| 2024, 2026 | State-Mandated Density (TOD) | Blanket Rezoning of 31 Precincts | Centralization of planning power; massive unearned value uplift for landowners. |
By 2026, the planning system in New South Wales operates as a centralized delivery method for density. The "State Significant" designation, once reserved for major infrastructure, has trickled down to residential precincts, normalizing the bypass of local democracy. The Barangaroo development remains the physical totem of this system: a project where a casino operator successfully sued the state government to protect its views, and where planning controls were repeatedly modified to accommodate increased floor space at the expense of public land. The Crown Resorts tower stands not just as a hotel, as a monument to the reality that in New South Wales, the planning act is malleable for those with the capital to bend it.
The pattern of scandal, inquiry, and legislative tweak continues, yet the core remains unchanged. Whether through the barrel of a Rum Corps musket, a paper bag of cash in the Askin era, or a sophisticated rezoning submission in the 2020s, the extraction of private wealth from the public planning system defines the state's built environment. The TOD program of the mid-2020s, while delivering necessary housing stock, has entrenched a model where the financial viability of development dictates the shape of the city, leaving communities with increased density frequently lagging infrastructure.
Climate Data: Temperature Anomalies and Hydrological Shifts
The climate history of New South Wales (NSW) reveals a territory defined by extreme hydrological volatility, a characteristic that has intensified measurably from the pre-industrial era to the present day. Paleoclimate reconstructions using coral luminescence from the Great Barrier Reef and tree ring data from southeastern Australia indicate that the region's hydroclimate has oscillated violently for centuries, long before the establishment of the instrumental record. Data extending back to 1700 shows that the arrival of the Fleet in 1788 coincided with a strong La Niña phase, resulting in wet conditions that misled early surveyors regarding the land's agricultural viability. This period quickly gave way to the "Settlement Drought" of 1790, 1793, an event linked to a severe El Niño episode. Historical journals from 1791 record temperatures so extreme that settlers observed bats and birds dropping dead from the heat in Parramatta, a phenomenon consistent with modern temperatures exceeding 42°C.
Instrumental records, standardized by the Bureau of Meteorology (BOM) starting in 1910, show a clear departure from these historical baselines beginning in the mid-20th century. Between 1910 and 2026, NSW mean temperatures have risen by approximately 1. 5°C, with the rate of warming accelerating after 1970. The frequency of extreme heat events has tripled in this period. The "Federation Drought" (1895, 1903) serves as a historical benchmark for agricultural collapse, yet modern data shows that recent droughts operate under hotter background conditions, increasing evaporation rates and soil moisture deficits. The "Millennium Drought" (1997, 2009) demonstrated this shift, where rainfall deficits were compounded by higher temperatures, a that scientists refer to as "hot drought."
The period from 2017 to 2020 represents a statistical outlier in the state's climate history, characterized by the catastrophic Black Summer bushfires. In 2019, NSW recorded its driest and hottest year on record, with a mean temperature anomaly of +1. 95°C above the 1961, 1990 average. This extreme heat drove forest fuel flammability to record levels. The subsequent hydrological whiplash was immediate. The 2020, 2022 triple La Niña event brought record-breaking rainfall, culminating in the 2022 floods where Lismore recorded daily rainfall totals exceeding 400mm. This sequence, extreme drought followed immediately by extreme inundation, defines the current climatological state of the province.
Recent data from 2024 through early 2026 confirms that this volatility has become the new norm. The year 2024 ranked as the second-warmest year on record for NSW, with a mean maximum temperature anomaly of +1. 71°C. Even with high rainfall in parts of the state, background temperatures remained dangerously high. Ocean temperatures off the NSW coast also reached record highs in 2024, providing the thermal energy necessary for the intensification of East Coast Lows. These systems are capable of holding 7% more moisture for every degree of atmospheric warming, leading to "rain bomb" events that overwhelm traditional drainage infrastructure.
The hydrological shifts observed in 2025 provide a clear example of this intensified pattern. In May 2025, a stationary low-pressure trough directed an atmospheric river into the Mid North Coast and Hunter regions. Taree and Port Macquarie experienced their heaviest May rainfall on record, with Careys Peak recording 533mm in a single event. This system, described by the BOM as a 1-in-500-year event for the region, caused catastrophic flooding just months after parts of the state had entered a drying phase. The 2025 annual summary indicates a mean temperature anomaly of +1. 49°C, making it the fifth-warmest year since 1910, even with the cooling influence of the rainfall events. The juxtaposition of a 4% annual rainfall deficit across the state against localized, extreme flood events highlights the uneven distribution of water resources.
As of March 2026, early data suggests a return to heatwave conditions. January and February 2026 saw heat accumulation in the western districts, with anomalies reaching +2. 0°C in the interior. The soil moisture profile remains erratic; deep soil in the Murray-Darling Basin show persistent deficits, while upper fluctuate rapidly between saturation and desiccation. This decoupling of surface weather from long-term hydrological health poses a serious problem for agriculture, as the window for optimal planting and harvesting narrows between flood risks and heat stress.
| Period / Year | Primary Climate Driver | Temp Anomaly (vs 1961-90) | Key Hydrological Event / Metric |
|---|---|---|---|
| 1790, 1793 | El Niño (Strong) | N/A (Est. Extreme Heat) | Settlement Drought; Parramatta biological heat stress event (1791). |
| 1895, 1903 | El Niño / IOD Positive | -0. 4°C (Est.) | Federation Drought; Murray River ran dry at Swan Hill (1902). |
| 1955 | La Niña | -0. 6°C | Maitland Floods; Hunter River peaked at 12. 3m. |
| 2019 | IOD Positive / El Niño | +1. 95°C (Highest Recorded) | Black Summer; State rainfall 55% average. |
| 2022 | La Niña (Triple) | +0. 65°C | Northern Rivers Floods; Lismore height 14. 4m (Record). |
| 2024 | El Niño to Neutral | +1. 71°C (Max Temp) | 2nd Warmest Year; High coastal precipitation, warm oceans. |
| 2025 | Neutral / Local Trough | +1. 49°C | May Floods (Mid North Coast); 533mm rainfall at Careys Peak. |
The mechanics driving these shifts are rooted in the expansion of the Hadley Cell and the poleward shift of the subtropical ridge. This movement pushes winter rainfall systems further south, depriving the agricultural belts of southern NSW of reliable cool-season rain. Conversely, the warming Tasman Sea acts as a capacitor for moisture, energizing storm systems that method from the east. The data shows a 16% decline in April-October rainfall in the southwest of the continent since 1970, a trend that correlates with the drying of catchment areas feeding the major dam systems. Sydney's water security relies heavily on the Warragamba Dam, which oscillates between dangerously low levels (as seen in 2006 and 2019) and rapid spill events (2022, 2025).
Future projections based on the 2024-2026 trend lines indicate a continued increase in fire weather days. The Forest Fire Danger Index (FFDI) has risen significantly across the state, with the fire season extending into spring and autumn. The concept of a "safe" season is. The 2025 data confirms that heavy rainfall events are becoming more intense, with hourly rainfall rates increasing by approximately 7-10% per degree of warming. This intensification overwhelms soil infiltration capacity, leading to flash flooding even in areas with pre-existing moisture deficits. The state faces a dual hazard: a thirstier atmosphere that strips moisture from the land at accelerated rates during dry spells, and a more volatile atmosphere that releases that moisture with destructive force during storm events.
WestConnex and Infrastructure Budget Variances
| Project | Era | Initial Estimate / method | Final / Current Cost | Outcome |
|---|---|---|---|---|
| Rum Hospital | 1810-1816 | £0 (Rum Monopoly Trade) | Social Cost: Alcoholism epidemic | Built with defects; monopoly distorted economy. |
| Sydney Harbour | 1923-1932 | £4. 2 million | £13. 5 million (approx. $1B in 2025 AUD) | Tolls remained until 1987 to pay off debt. |
| WestConnex | 2012-2023 | $10 billion | $21+ billion (inc. integration works) | Privatized until 2060; severe congestion at Rozelle. |
| Sydney Metro West | 2018-2030 | $12-16 billion | $29 billion (2025 estimate) | Delayed opening; consumed budget for other lines. |
The Rozelle inquiry of 2024 exposed the human cost of these variances. Residents in the Inner West faced 24-hour construction noise, property damage from vibrations, and a final road layout that funneled local traffic into bottlenecks to protect the velocity of the toll lanes. The inquiry found that the government had lost control of the project to the private operators, with Transurban holding the data and the use. This power imbalance was baked into the contracts signed during the privatization frenzy of 2018-2021. By 2026, the NSW government found its hands tied by "compensation clauses" that penalized the state if it took actions that reduced toll revenue, such as improving competing public transport routes. The 19th-century railway boom offers a clear warning for the current metro expansion. In the 1880s, the colony borrowed heavily from London to build rail lines to nowhere, driven by political pork-barreling rather than economic utility. When the global economy turned in the 1890s, NSW was left with a crushing debt load that took decades to service. The Metro West blowout suggests history is repeating. The $29 billion price tag for a single line has cannibalized funding for schools and hospitals, forcing the state to delay other essential upgrades. The "recycling" of assets has run its course; there are no more electricity grids to sell. In the end, the WestConnex saga is not about a road. It is a case study in the transfer of wealth from the public purse to private equity, facilitated by a government prioritizing ribbon-cutting ceremonies over fiscal probity. The "Rum Hospital" stands today as Parliament House, a fitting irony. The legislators debating the budget inside that building are the direct heirs of the system Macquarie created: funding the state's ambitions by mortgaging the future of its citizens. The gridlock at Rozelle is not a malfunction; it is the calculated result of a business model working exactly as designed.
Coal Dependency and Renewable Energy Integration Rates
| Asset Name | Type | Capacity (MW) | Status (March 2026) | Notes |
|---|---|---|---|---|
| Eraring | Black Coal | 2, 880 | Operational (Extended) | Closure delayed to Aug 2027/29. Underwritten by NSW taxpayers. |
| Bayswater | Black Coal | 2, 640 | Operational | Scheduled to close roughly 2030-2033. serious baseload provider. |
| Liddell | Black Coal | 2, 000 (Historical) | Decommissioned | Closed April 2023. Demolition and site remediation underway. |
| Kurri Kurri | Gas/Diesel Peaker | 660 | Commissioning | Years late. Cost>$2bn. intended to backfill Liddell. |
| Waratah Super Battery | Battery Storage | 850 | Operational | World's largest standby battery system. Stabilizes grid frequency. |
| Mt Piper | Black Coal | 1, 400 | Operational | Youngest coal plant (1993). Faces fuel supply constraints from local mines. |
The 2026 energy reality for New South Wales is a hybrid of zombie coal assets kept alive by subsidies and a renewable network waiting for connection. The state exports record volumes of thermal coal from the Port of Newcastle, over 140 million tonnes annually, feeding the energy needs of Japan, Korea, and Taiwan, even as its domestic grid struggles to metabolize its own transition. The revenue from these royalties supports the state budget, creating a feedback loop where the government funds the transition away from coal with the proceeds of selling it. This economic dissonance defines the mid-2020s: a grid caught in the friction between the inertia of the 20th century and the unbuilt infrastructure of the 21st.
2026 Fiscal Deficit and Credit Rating Analysis
As of March 2026, the New South Wales Treasury operates within a fiscal straitjacket defined by structural deficits and a debt load that has tripled since the pre-pandemic era. The 2025-26 Half-Yearly Review, released in December 2025, places the state's operating deficit at $3. 1 billion. While this figure represents an improvement from the $5. 7 billion shortfall recorded in 2024-25, it confirms that the state remains in the red. The Minns Labor Government, having abandoned the public sector wage cap, faces the dual pressure of escalating employee expenses and a gross debt trajectory projected to hit $177. 2 billion by June 2026. This debt load requires an annual interest payment of $7. 7 billion, a sum that exceeds the entire budget of smaller government departments and represents "dead money" that cannot fund schools, hospitals, or transport.
The state's credit rating remains a battleground of conflicting assessments. S&P Global Ratings affirmed its AA+ long-term issuer credit rating in November 2025 maintained a "negative" outlook. This assessment signals a absence of confidence in the state's ability to rapidly consolidate its fiscal position. S&P analysts cite the state's high capital expenditure and the difficulty of reining in operating costs as primary risks. In contrast, Moody's and Fitch continue to assign NSW a AAA rating, creating a in how global markets view the state's creditworthiness. The loss of the uniform AAA status, which occurred during the COVID-19 spending surge of 2020-2021, continues to inflict a reputational cost, although the state's borrowing costs remain manageable due to the broader stability of the Australian sovereign rating.
A serious friction point in the 2026 fiscal terrain is the distribution of Goods and Services Tax (GST) revenue. The Commonwealth Grants Commission (CGC) assigned NSW a GST relativity of 0. 86034 for the 2025-26 financial year, a decrease from the previous year. This seemingly technical adjustment has real-world consequences, reducing the state's share of the national GST pool at a time when revenue is most needed. NSW officials frequently that the state subsidizes other jurisdictions, particularly as the "standard state" transition method, designed to ensure no state falls the fiscal capacity of NSW or Victoria, continues its six-year implementation phase. Even with the federal "no worse off" guarantee, which injects supplementary funding to compensate for the caused by the 2018 GST deal with Western Australia, NSW Treasury the system fails to account for the state's massive population-driven infrastructure needs.
| Metric | Value / Status |
|---|---|
| Operating Deficit (2025-26) | $3. 1 Billion (Projected) |
| Gross Debt (June 2026) | $177. 2 Billion |
| Interest Expense (2025-26) | $7. 7 Billion |
| S&P Credit Rating | AA+ (Negative Outlook) |
| Moody's Credit Rating | AAA (Stable) |
| GST Relativity | 0. 86034 |
| Public Sector Wage Rise | 3. 0% (plus superannuation) |
Expenditure control has been complicated by the removal of the public sector wage cap, a policy shift that took full effect in the 2024-2025 budget pattern. The multi-year agreement reached with the Public Service Association and other unions locked in a 4% pay rise for 2024-25, followed by 3% increases in 2025-26 and 2026-27. This deal also includes a Cost of Living Allowance (COLA) trigger, which activates if the Sydney Consumer Price Index (CPI) exceeds specific thresholds. While this policy quelled industrial unrest, it higher structural costs into the budget. Employee expenses account for the largest share of recurrent spending, and with the 2026-27 wage increase of 3% looming, the Treasury has limited room to maneuver if revenue receipts from stamp duty or payroll tax underperform.
Historical analysis shows the magnitude of the current debt position relative to past crises. In the 1890s, NSW faced a severe depression driven by a collapse in wool prices and a halt in British lending for public works, forcing a brutal contraction in state spending. More famously, the 1932 constitutional emergency saw Premier Jack Lang attempt to default on interest payments to British bondholders during the Great Depression. Lang's "Plan" to withhold money from the federal government led to his dismissal by Governor Philip Game, a seminal moment in NSW political history that established the sanctity of debt obligations. While the 2026 debt-to-GSP ratio of approximately 20% is far more manageable than the insolvency threats of the 1930s, the sheer nominal value of the debt, method $200 billion by the end of the decade, places the state in uncharted territory for peacetime borrowing.
The infrastructure pipeline, once the crown jewel of the Coalition government, has faced scrutiny and recalibration under Labor. The "megaproject" era has given way to a focus on essential maintenance and housing-enabling works. The 2025-26 budget allocated significant funds to the "Building Homes for NSW" program, attempting to use state balance sheet capacity to unlock housing supply. Yet, the capacity to recycle assets, selling mature infrastructure to fund new builds, has diminished. The previous government's sale of electricity networks (TransGrid, Ausgrid, Endeavour Energy) and WestConnex provided a capital injection that is no longer available. Consequently, new capital works must be funded primarily through debt, directly feeding the gross debt figure and the associated interest bill.
Looking ahead to the 2026-27 budget, the route to the promised 2028 surplus is narrow and with risk. The Treasury projects a deficit reduction to $1. 1 billion in 2026-27, this relies on sustained strength in the property market to drive transfer duty revenue. Any cooling in Sydney's housing prices, triggered by interest rate shifts or broader economic stagnation, would blow a hole in these revenue forecasts. Also, the "negative outlook" from S&P serves as a constant warning: any slippage in fiscal discipline, whether through unbudgeted wage blowouts or cost overruns on the Metro West project, could trigger a downgrade to AA. Such a move would increase the cost of servicing the state's debt, creating a vicious pattern of higher interest payments and deeper deficits.
The fiscal terrain of 2026 is one of high and limited options. The state has exhausted the "easy" levers of asset recycling and wage suppression. Future solvency depends on a delicate balance: growing the economy faster than the debt pile while managing the voracious service demands of a population exceeding 8. 5 million. The era of fiscal abundance is over; the era of hard choices is well underway.